
The analysis of movement of shares prices divided into two types,
- Fundamental analysis
- Technical analysis
The object of the both analysis is buying shares at near low prices and sells near high price to get good returns on investment
Fundamental Analysis:
Analyze real worth of the share based on current and feature earning capacity of the companies, for this purpose; they analyze the particular business balance sheet, P/L A/c, and MIS statements and they analyze particular sector currently and future growth rates also.
Technical Analysis:
The technical analysis analyzes the market and trend of the individuals script (here trend means a direction of the movement) based on the historical data the price and the volumes, with the help of the charts. Technical analysis means nothing but study Charts.
Technical Analysis definition: –
The technical analysis defines as ”the process of identifying the near future trends by analyzing historical data, primaries prices and value of stocks, with the help of chart”.
Now a day’s technical analysis is used in 3 ways: –
- To study past decades Bull & Bear market trends
- Supply and demand principle applicability in stocks
- Buying share at near low price and selling at near high price
History of Dow Theory
- The Charles Dow is the granddaddy of technical analysis
- This theory was developed by Charles Dow in 1897. First, it published in the Wall Street Journal between 1900 to 1902.
- To know the overall trend of the market, he developed two broad market averages, one was Rail average. It composed with 20 railroad averages and second was industrial average it composed of 13 blue chip companies (all other types of companies)
- At presents the Dow- Jones stock composed was compared the average of 20 rails, 30 industrial and 15 utility stocks
- A.J.Nelson, a close friend of Dow, popularized and formalized this theory for economic forecasting
Entire Dow theory is divided into 6 Concepts: –
- Assumptions
- Trends
- Swings (or) waves
- Phases
- Volumes
- Tops and Bottoms
Assumptions
- Average (Index) discount everything (fears, hopes, muscle power –days only, inside information, natural calamities, etc.theory)
- Primary trend manipulation not possible
- Theory does not provide time frame and price targets; just it discussed broader trend of the market only (either upward o downward)
- It (Dow Theory) Possible to make mistakes, it not final tool, but a way to understand it better
Trends
Primary trend: – The overall trend of the market, either upward or downward, is called the primary trend. This trend lasts for over a period of one year (or) several years primary trend manipulation not possible
Secondary trend:-
Index or script straight line upward (or) downward is not possible at some points of time, market should correct
These correction trends are called secondary trends. This trend lasts for over a period of 3 weeks (or) several months, these trends manipulation also not possible. These intermediate trend markets retrace (correct) 38.2%, 50%, 61.8% (according to Dow33% to 66%) level of earlier rise or fall
Minor trend (Manipulation trend): –
These trends usually take less than six days, rarely three weeks. These terms mislead you, so ignore these minor trends. These trends occur, whether a secondary or the segment of a primary between two successive secondary’s, it made up for a series of a series of three (or) more
Minor trends will be in divergence to primary trend
Swings (or) Waves (Fluctuations)
By nature, Charley Dow swings –Fluctuation divided into three types, and he compared these fluctuations with sea water movements.
Ripples: –This inception (beginning) swings are very small swing
Waves: –After strengthening these ripples convert into waves
Tides: – After some time these waves turn into tides (A rise and fall in the level of sea are called tide)
Phases
Entire bull trend and bear trend Charles Dow, each trend divided into 3 phases, these are
Bull trend 3 phases:-
Phase 1: – During the bull market in Phase one, the market move based on the revival of confidence shortly of the business, here generally informed investors participate, common investors not participate.
Phase 2: – In this phase, investors participate based on corporate earning and peek economic conditions, it leads to speculation and inflation
Phase 3: – In this phase, general public (mass) participate, record corporate earnings and peek economic conditions, it leads to speculation and inflation
Bear trend 3 phases: –
Phase 1: – In this phase, informed investors exit from the market. First, they recognize peak(speculation rise of the market and they abandon hopes of near future upwards
Phase 2: –Investors exit; they recognize slackness in corporate earnings and business
Phase 3: -General public (mass) exit, Financial crisis occur at this stage panic and distress selling start, nobody ready to buy all these leads to blue-chip shares price also come to earth
Volumes
Bull trend: –The main trend is bullish, volumes increase when the price rise and volumes decrease in secondary reactions
Bear trend: –The main trend is bearish, volumes increase when the price fall and volumes decrease in secondary reactions
Top and Bottoms
Bull trend: – Bullish primary trend formed with higher tops and higher bottoms see the grapes for more
Clarifications: –
- Top ‘T1’ posted during phase 1 and makes the bottom at ‘B1.’
- Top ‘T2’ posted during phase 2 and makes the bottom at ‘B2.’
- (‘T2’ is higher than ‘T1’, and ‘B2’ is greater than ’B1’ it represents higher tops and higher bottoms)
- Top ‘T3’ posted during phases 3 and makes bottom at ‘B3’ (‘T3’ is greater than ‘T2’)
Bear trend: – Bearish formed with lower tops and lower bottoms; see the graph for more clarifications
- Bottom ‘B1’ posted during phase1 and makes Top at ‘T1.’
- Bottom ‘B2’ posted during phase 2 and makes Top at ‘T2’ (‘T2’ is lower than ‘T1’ and ‘B2’ is lower than ‘B1’, it represents lower tops and lower bottoms)
- Bottom ‘B3’ posted during phase 3 and makes at T3
Charts analysis
It is of 3 types
Stages 1: -Line charts analysis —-> for long-term trends (1-year or 2 years).
Stages 2: –Bar charts analysis —–> to know trend reversals in short terms (6 months)
Stages 3: – Candlestick charts analysis —-> to know trend reversal in short-term
Chart Construction:-
- Data are plated as daily, weekly and monthly on closing price basis (weekly closing price = closing price on Fridays)
- In the daily chart, we use daily data and for weekly and monthly chart, we use weekly and monthly data respectively
- The prices are plotted on the XY chart; where the X-axis represents the time and Y- axis account for the value of the scrip.
- X-axis represents the actual trading days only (i.e. excluding Saturdays and Sundays and holidays)
- In technical analysis, we discuss different types of trends (direction of movement) patterns (models or shapes) with the help of chart
Chart analysis in Steps: –
Here we are going to discuss the following
- Trends
- Trend lines
- Supports
- Resistances
- Support becomes resistance
- Resistance becomes support
- Bull traps and
- Bear traps
Trends
Upward price trend (Uptrend)
- Upward price forms higher tops and higher bottoms (or) by a series of ascending short term tops and bottoms
- The upward trend is established tentatively when the second bottom is greater than the first bottom and we confirm when the third bottom greater than the second bottom.
- Here buyers dominated the sellers (Buyers more in number then secures)
Downward price trend:-
- Downward price trend is formed with lower tops and lower bottoms (or) by a series descending short terms tops.
- Downward price trend is established tentatively with the second top is lower than the first top and we confirm when second top is lower than first top
- Here sellers are more eager to sell than the buyers to buy
Non-trend: –
- A trading range series is formed with equal tops and similar bottoms within its limits, which can narrow, wide or anywhere in between
- Here sellers and buyers are both equally eager (If seller dominate, script takes downtrend and If buyer dominates script takes downtrend)
Support and Resistance
Support: – (Support= Buyer domination)
Resistance: – (Sellers domination)
Trend Reversals
- A falling script cannot fall always. A rising script cannot keep rising always
- Any script taking continuous upward and downward is not possible at some point f time, script in upward or downward, it will tire like this continuous script, change the direction of the trend and it volatile the trend line. These changes in the direction of the trend and violation of trendline are referred to a trend reversal
- Identifying trend reversal is not easy at the time of identifying trend reversal, your experience is critical trend line violation not treated always as trend reversal.
- There is no fixed rule to determine the trend reversal, your experience is crucial.
Patterns
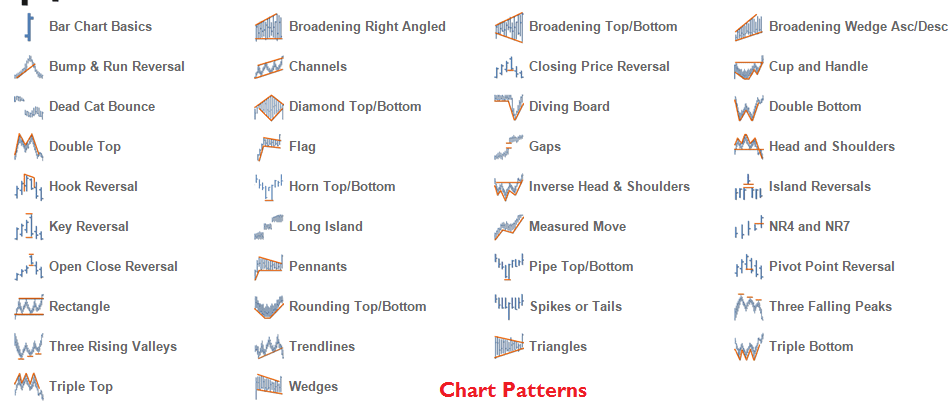
Charts analysis in step-2. We are going to discuss patterns (models or shapes) Generally patterns are formed in narrow range price movement (congestion) –moving in sideways, these small range price movements formed in the shape of the rectangle, triangle, and flags, etc.
Patterns formed in four scenarios
- Top reversal
- Bottom reversal
- Bullish continuation and
- Bearish continuation
Reversal Patterns: –
Double Top Patterns
* To form this pattern takes two weeks – 1 month period
* Double top pattern gives second chance to exit, in case if you miss first chance
- Head and shoulder pattern: –
To form this pattern takes two months – 3 months period
Please observe huge volumes and SMA (15 days) also, at the time of neckline break down
Complex head and shoulders: –
- Complex head and shoulders (starting line neckline)
- To form this pattern takes four months – 6 months period
- Please observe 50 days, SMA break down also.
Rounding Top: –
To form this pattern takes three months – 6 months period.
Pattern confirmation: when price move below 50 days moving average, it confirm downtrend in short-term
Descending Triangle: –
- To form this pattern takes two months – 4 months period
- The price may go out through apex in horizontal direction; the entire pattern loses its significance
- The whole pattern represents seiner’s eagerness compare to the buyer.
Wedge pattern: –
Generally banks show this pattern
To form this pattern takes one month- 2 months period
Bottom Reversal Patterns:-
- Double Bottom: –
To form this pattern takes two weeks – 1 month period
Inverted head and shoulder:-
- To develop this pattern takes two months – 4 months period
- Pattern may form above four months period; please observe 50days SMA also
Rounding Bottom: –
Ascending Triangle: –
- To forms, this pattern takes two months – 3months period
- In case, the price may go out through apex, in horizontal direction, the pattern loses its reliability
Wedge pattern: –
2 months – 4 months
Here buyers and servers are both equally eager
If buyers dominate, break down with huge volumes
If price goes out through apex in horizontal direction, pattern loses its significance
Broadening triangle as bullish continuation pattern: –
This broadening triangle formation is very powerful and quite rear. It forms at top has a bullish continuation pattern
It takes two months – 3 months period
Broadening triangle as bearish continuation pattern: –
- It takes two months – 3 months period
- Very bad pattern and it forms a peak of the price, before trend reversal
Bullish flag as continuation upward pattern: –
- comes in reliance counter, very dangerous pattern
- It takes two months – 3 months period
- It misleads because it forms against the trend
- Be very careful
Bearish flag as continuation downward pattern: –
- It takes two months – 3 months period
- forms in reliance and it is a dangerous pattern because it forms against the trend
Cup and handle bullish continuation pattern: –
- This pattern identified by ‘0’ nil in 1988.
- It takes two months – 4 months time to make cup(only) pattern, to form handle pattern takes two weeks time
- Depth of the cup retrace 38.2%, 50% (or) 61.8% level o immediate previous advance
When price breakout, cup and handle pattern the price targeted to minimum equal to the depth of the cup price
Cup and handle bearish continuation pattern: –
Please reverse above-said rules
Diamond pattern: –
Generally, SBI shows this pattern
Here diamond pattern, discussed in 4 ways: –
- Diamond pattern as Bullish (top) reversal
- Bearish (bottom) reversal
- Bullish continuation and
- Bearish continuation
These pattern formed several months with high volumes (fewer volumes decrease the reliability of pattern)
Miscellaneous Patterns: –
Parabolic Curve: –
- The parabolic curve is an attractive curve; it accelerates the stock price until it is going almost straight up
- This skyrocketing price indicates excessive speculation and be cautious in this situation and avoid buying the stock
- At what level buyers are not interested in further speculation the stock price takes step fall. The main risk here is the prediction of target
Flatline formation: –
- Avoid this pattern stocks
- Dead counter
Erratic volatility: –
- These stocks are very risky because the prediction of exact price movement is not possible
- Avoid this pattern
Candle Stick Charts
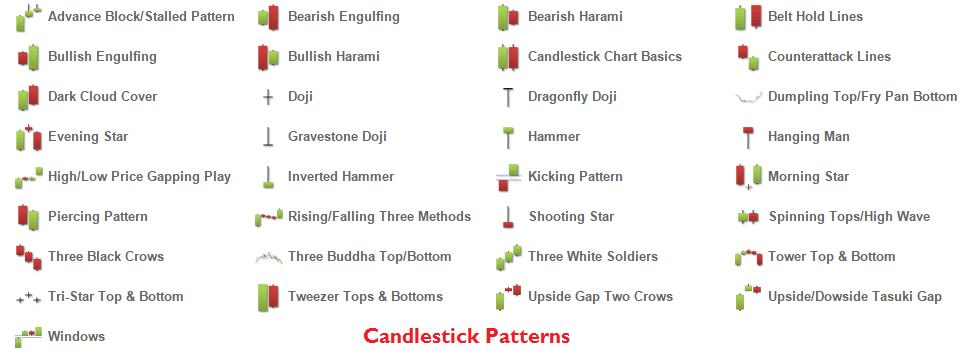
* Japanese candlesticks are first developed by Japanese rice traders in1600 century. Actually, candlestick charts worldwide popularized credit goes Steven Nison. He is one expert on the interpretation of candlestick patterns
* Candlestick charts provide visual insight into the current market psychology and its powerful method of analyzing and timing to stock and future markets
*Japanese candlestick offers a quick picture into the psychology of the short-term trading, studying the effects, not causes and incidents. The fact that prices influenced by investors psychologically drive emotions of fears, greed and hope
* The candlestick chart represents the open, high, low and closing prices on a daily basis. Each day’s activity is represented by a candlestick
* There are three types of candles sticks
- White or Green candlestick
- Black or Red Candlestick
- Doji Candlestick
* The interpretation of the candlestick charts is based primarily on patterns. These patterns are two kinds;
- Bullish Reversal Pattern [Bottom Reversal pattern]
- Bearish Reversal Pattern [Top reversal pattern]
Bullish Reversal Patterns:-
- Hammer (Ground o Soil)
- Confirmation required
- The colour of the body is not necessary. But, Green colour is more powerful than Red colour.
- It’s a short covering pattern [Definitely upward pattern]
- Bullish Dragonfly Doji: –
* Confirmation is just required (option) [ If it occurs in oversold zone, confirmation is not mandatory]
* Stronger than hammer pattern
* It is also shot covering pattern
Bullish Engulfing Pattern: –
* Perfect bar reversal
* White candle completely covers black candle
* Confirmation is suggested
* The white body day volumes exceed black body volumes which indicate strong short covering
- Piercing pattern: –
*Confirmation is suggested
* Both days of the piercing pattern should be long days. Its penetration is greater than 50 %. This pattern has better chance to be successful
* The white body which opens below the low of the previous day is compulsory
- Bullish Harami (Pregnant lady): –
* Confirmation is strongly suggested
*Second-day body volumes exceeded previous black body volumes which indicate great short covering.
- Bullish Harami Cross: –
* Confirmation is not required
*Harami cross is more bullish than Harami
* We need to observe volumes too
- Inverted Hammer: –
- Confirmation is required
- Color of the body is not necessary, but white body is stronger than the black body
- market open with down gap, a rally throughout the day and fail, closed near it’s open
- Closing movement bears take opportunity to cover their short positions
Bullish gravest Daji: –
*Confirmation is just required
* Gravestone Doji can occur only on the ground, not in the air it’s a bullish indication at a market low
- Morning Start (Grey = either white (or) black)
*No confirmation is required
*Body colour is not necessary (White body > black body)
*The second day, the star has always gaped from the body of the first day
- Morning Doji Star: –
*No confirmation is required
*It’s very dominant pattern when it occurs at the end
*It’s more powerful then morning star pattern
Bullish abandoned bay: –
*No confirmation is required
* It’s stronger than morningstar Doji and morning star
- The tri-star: –
* Confirmation is suggested (my opinion no evidence is required)
* I feel it is very powerful than morning star, morning Doji star and abandoned baby
* This pattern extremely rare and it warns about trend change when it occurs at the end of the bear trend
Bullish meeting lines (counter attack lines): –
Confirmation is recommended
* Both days should be long days and both closing price is same
* If the third day opens higher, it confirms trend change
* Many times, the second day is not as first days; this doesn’t give effect ability
- Bullish belt hold:-
*Confirmation is required
* Marabou candlestick —–> Means close-cropped (or) crossed out open (without visible shadow)
- Three white soldiers: –
*No confirmation is required
* When you saw like this pattern, you please come to an idea that market is entering as most in long bull run (long-term bull) not suggested for intraday
*Like this pattern occur at the end of the downtrend
*This pattern formed with three consecutive long white bodies each day open within the previous day body and each day closed at a new high.
- Bullish Kicking: –
*No confirmation required
* Here black marabozu followed by a white marabozu. The market direction is not as important
*A gap must occur between the two marubozu
* Even the market is in downtrend, if we see this pattern, it will rise for min 2 days.
- Bullish matching low: –
- Confirmation is suggested
- Both closings at same are compulsory, the bodies of the two days are not necessary
- Three inside up pattern: –
*No confirmation required
*It’s an extension of harami pattern
- Three Outside up pattern: –
*No confirmation required
* It’s an extension of engulfing pattern
- Spin pattern
*It’s an indecisive pattern
* Wait and batch observe next day for confirmation
*Color of the body is not important (But white > black)
Long-legged Doji: –
*Next day confirmation is required indecisive pattern
* Stronger than spin pattern
Bearish Reversal patterns: – (Top Reversals)
- Hanging man: –
* Confirmation is required.
* Color of the body is not important
*Black color is stronger than white color
* Comparatively body 2 ½ times shadow is strengthening the pattern
2.Bearish Dragonfly Doji: –
*Confirmation is just required
*This is stronger than hanging man
3.Bearish engulfing: –
* Confirmation is suggested
* Black body day volumes exceed white body day volumes
* Black body day candle open at new high and then equally it close below the open of the previous day
- Bearish piercing pattern ( Dark cloud cover pattern)
- Confirmation is suggested
- Red body open above the previous day high is compulsory
- The second day (Black cloud) closes within but below the midpoint of the previous day’s body (Green body)
- Both days are long days
- Bearish Harami: –
- Confirmation is strongly suggested
- Second-day body formed within the first-day body
- Second-day volumes lower volumes comparing with the first-day volumes it shows traders suspicion on the present market trend
- Bearish harami cross: –
- Confirmation is not required
- Bearish harami cross is more bearish than harami pattern
- Please observe the volumes of harami cross
- Shooting Star:
- Confirmation is required
- Shooting star formed with gap open after an uptrend, colour of body is not important but black body is more bearish comparing with white body
- The shadow is, at least, three times as long as the body
- Bearishgrave stone Doji: –
- Confirmation is just required
- This pattern is more bearish than shooting star
- This pattern formed with gap open after an uptrend, it trades at higher throughout the day and closes at open
- Evening Star: –
* Confirmation not required
* Color of body not important (for gray –star) but black> white
- Evening Doji Star:-
* No confirmation required
* Powerful than morning star
- Bearish Abandoned Baby: –
No confirmation required
*It occurs at the end of the uptrend, the second day is a Doji whose shadow gap above previous days upper shadow
- Bearing tri-star: –
* Confirmation is required
* Very powerful than evening star, evening Doji and abandoned baby
* Second-day open dap above from the first-day Doji
- Bear meeting lines (counter-attack lines): –
*Confirmation is suggested
* Both days should be long days and both day’s closing price is same
Gap Theory:-
* This theory has a success of 90 %
* It is an excellent method to find the support and resistance points of a scrip in the short term and long term generally gaps we can Interstate in daily candlestick charts
* Gaps are formed in both uptrend and downtrend, gaps formed in uptrend are called “Gap ups” and Gaps formed in down trend are called “Gap downs” both gaps are shown below
* Gaps are broadly classified into 5 Categories
- Common Gap: – (Don’t consider these)
Gaps may occur within the patterns are caused common gaps
Ex: – Gaps within the rectangle, triangle, and flag these gaps do not decide the overall trend of the market & don’t consider these gaps
- Gaps within the rectangle
- Gap within triangle
- Breakout gaps: – (strongly consider)
- Pattern breakout –Gap up
- Pattern break down –Gap down
- Runaway Gaps: – (Dangerous)
- Upward runaway gap
- Down run away gap
- Exhaustion gap (Max 4):
- Island reversal gap (Trend reversal gaps): –
- Island reversal gap-as top reversal (In over bought-gap)
Leading and Lagging Indicators
* Market does not move either up or down in a straight line the up moves and down moves are interrupted by counter moves, quite often, we confused by these counter moves to decide the real trend(uptrend or downtrend) of the market
* Like this confusing condition, we follow indicator to know the trend of the market, an indicator is a mathematical and statically calculation of movement of share price, these calculations we convert into charts for ease study purpose
Indicators are divided into 3 types
- Leading Indicator (oscillators –momentum indicators)
- Lagging indicator
- Leading indicator and logging indicator (MACD)
Leading Indicators: –
*Leading are used to identify the entry point before a new trend takes place, leading indicators are squiggly lines found above and below of the price chart
* Leading indicators further we divide into 2 types centred oscillator and banded oscillator. This centred oscillator move above and below the zero line, is best suited for analyzing the direction of price movement banded oscillator fluctuate above and below within 2 bands (0 to 100 scale) that represent extreme price levels,
Lower band represent oversold and
Higher band represent overbought
Example to leading indicators
Centered oscillator Banded oscillator
* Rate of change (ROC) *Relative strength index (RSI)
* Stochastic to balance volumes
Lagging Indicators: –
Lagging indicators give entry signal after trend begun, these indicators useful during trending period, not active in trading and sideways markets, logging indicator is drawn on top of the price chart, therefore these referred to as overlays
Ex: -Simple moving average, Weighted moving average, Exponential moving average, Triangle moving average, Bollinger bands, Envelopes etc
Note: –MACD is leading and lagging indicator (opinion)
Uses of indicators: –Alert, confirm and predict (guessing future)
Lagging indicators –Moving Averages
The moving average is an indicator. It shows average moving of security price over a period in pre-determined time (Here pre-determined time means 15 days moving average for term short analysis and 200 days moving average for long-term analysis)
Simple moving average: –
Calculation of 5 days simple moving average
Date Price SMA
1/1/2001 30.00
2/1/2001 32.00
3/1/2001 35.00
4/1/2001 38.00
5/1/2001 40.00 35.00
8/1/2001 45.00 38.00
9/1/2001 44.00 40.00
10/1/2001 41.00 41.00
11/1/2001 35.00 41.00
SMA on 5/1/2001 = 30+32+35+38+40 / 5 = 35
- Weighted Average: – (WMA)
Calculation of 3 days WMA
Date Price WMA
1/1/2001 10.00
2/1/2001 12.00
3/1/2001 13.00 (1*10+2*12+3*13) / (1+2+3) = 12.17
4/1/2001 15.00 (1*12+2*13+3*15) / (1+2+3) = 13.85
5/1/2001 14.00 14.15
8/1/2001 17.00 15.65
9/1/2001 18.00 17.00
10/1/2001 20.00 18.85
11/1/2001 19.00 19.15
12/1/2001 21.00 20.16
- Exponential moving average (EMA): –
Calculation of 4 days EMA
Date Price EMA
1/1/2001 10.00 10.00
2/1/2001 12.00 10.80
3/1/2001 14.00 12.08
4/1/2001 16.00 13.65
5/1/2001 15.00 14.20
8/1/2001 13.00 13.70
9/1/2001 14.00 13.80
Note: –
- Take the closing price on the first day as the exponential moving average for the day
- The actual 4 days exponential moving average can be had from 5th day onwards and so on
Here factor = 2 /n+1 (where n= 4)
There force factor = 2 /4+1 = 0.40
EMA calculation on 2/1/2001: –
===> (12-10) * 0.40 + 10 = 10.80
Note: –
The main defect in SMA is, it gives importance to post /beginning data
The main defect in WMA is, it gives importance to recent data
To avoid these two demerits (defects), we introduced EMA; It gives weight age to all data
Interpretation by using two moving average curves: –
The most attractive combination are given—–>
- For short-term ——> 7 days and 15 days moving the average
- for medium term ——> 20 days and 50 days movi9ng average
- for long-term —–> 100 days and 200 days moving the average
Envelopes
How we plotted envelopes on price chart, just draw two lines from above and below from ‘n’ day (ex- 20 day) Exp moving average line at a fixed percentage
Here upper line is called upper board, and lower line is called lower band
Bands % varies script to script; it depends on the historical volatility of the script
Calculation of 20 days EMA with 5% envelops bands as follow:-
Upper band: – 20 Exp moving averages + (20 day EMA x 0.05)
Lower band: – 20 Exp moving averages – (20 days EMA x 0.05)
[Nifty is 5 % fixed enveloped] —> Our opinion
Bollinger Bands
Bollinger bands were developed by John Bollinger; Bollinger bands are used to measure market volatility or script volatility. These volatility bands placed above and below an ‘n’ days SMA (ex- 20 days SMA) and a standard deviation levels, these bands automatically widen when volatility increase and narrow when volatility decrease these dynamic bands are volatile based on standard deviation
Bollinger bands display on top of the script as an indicator, calculation of Bollinger bands as follows: –
Upper band: —> 20 day SMA + (20 day S * 2)
Lower band: —> 20 day SMA – (20 days SD * 2)
Narrow bands indicate changing the trend in near future
Leading indicators–Oscillators:-
Oscillator is a tool to measure a periodic fluctuation between two things based on change in energy (best Ex: -to move to and fro like a pendulum)
Periodic between two prices based on change in strength
* Oscillators are also known as momentum indicators as they measure the market (Nifty) momentum or script momentum and change in momentum
* Oscillators are constructed with the help of the closing price days data, for short-term trading, we used daily closing price data constructed date constructed oscillators for long-term trading, we use weekly / monthly closing price date formed oscillators
* Oscillators, w interpret periodically (ex: – 14 days /14 weeks/14 months closing price data)
* Oscillators are plotted on the XY axis, X-axis represents the time, and the Y-axis represents the value of the oscillator
Note: – Oscillators are used along with the price chart and never isolation (alone)
R.S.I [Relative Strength Index]
* Time is crucial in investment management, here RSI helps you for timely and timely exit RSI was developed by Wells Wilder in June 1978(Future magazine and he recommended using a 14 day RSI)
*RSI is used to identifying the inner technical strength (or) weakness in a particular script or index
* RSI is a price –following oscillator that range between 0 and 100, the price upward tired (overbought) range in RSI chart is 70 to 80 between, the price downward hired (oversold) range in RSI chart is 30 to 20 between
14 days RSI calculation
Date Price in Rs Gain Loss
1/1/2001 100
2/1/2001 105 +5
3/1/2001 108 +3
4/1/2001 110 +2
5/1/2001 116 +6
8/1/2001 112 -4
9/1/2001 111 -1
10/1/2001 114 +3
11/1/2001 118 +4
12/1/2001 120 +2
15/1/2001 116 -4
16/1/2001 117 +1
17/1/2001 124 +7
18/1/2001 121 -3
19/1/2001 123 +2
Gain / Loss 35 12
14 days average = 35/14 =2.5 12/14 = 0.85
Average gain =2.5 average loss = 0.85
RS = 2.5/0.85 = 2.94
RSI = 100-100/(1+RS)
=74.62%
ROC (Rate of Change)
*The oscillator (ROC) measure the ROC between the current price and the price ‘n’ no. of days in the post. The different can be displayed either in points or as a percentage it’s helping to find the overbought zone and oversold zone.
* The most important period are for short-term follow 12 days ROC, for medium-term 25 days OC and long-term 200 day ROC, these period recommended by Gerald appeal
* The optimum overbought /oversold level of nifty are +7.25 and -7.25, to identify overbought/oversold levels, once look at the historically high levels and low levels also in ROC chart
Note: Extremely overbought / over-cold reading in ROC chart usually implies a continuation of current trend
Calculation of 6 days ROC
Date Price ROC
1/1/2001 845
2/1/2001 825
3/1/2001 825
4/1/2001 840
5/1/2001 825
8/1/2001 800 -5.3 (800/845 *100-100)
9/1/2001 815 -1.2 (815 /825 * 100-100)
10/1/2001 825 0
11/1/2001 825 1.8
12/1/2001 840 1.8
15/1/2001 850 6.2
ROC = (today’s price /price ‘x’ day ago) * 100 -100
= (800/ 845) * 100 -100
= 0.947 * 100 -100
= -5.3%
On – Balance Volume (OBV)
* OBV was developed by Granville in 1963, OBV was a cumulative volume indicator, and it shows buyers eagerness and seller pressure
* Here price up day volumes we treat positive volumes and price down day volumes we took as negative volumes, here we compared script upward cumulative volumes with script downward cumulative volumes
* And finally it measures positive and negative volume flow one more important point OBV would often move before price
* OBV calculation I have shown below:-
Date Closing (+ /-) Volume OBV
1/1/2000 70
2/1/2000 72 + 10,000 10,000
3/1/2000 75 + 16,000 26,000
4/1/2000 76 + 9,000 35,000
5/1/2000 74 – 11,000 24,000
8/1/2000 73 – 12,000 12,000
9/1/2000 76 + 14,000 26,000
10/1/2000 79 + 13,000 39,000
Fibonacci Theory
(To identify support and resistance)
Leonardo Fibonacci was born in Italy around the year 1170.He discovered the great pyramid of Gazed in Egypt was arranged in a sequence of numbers. This sequence of figures here we referred as Fibonacci numbers
* The movement of share price, here we studied with the help of Fibonacci number, these are Acre, Fans, Retrenchments and time zero, here discussed retrenchment only
* Retrenchment: – Draw a trendline between two extreme points, take trend line top as ‘0’ and low as ‘100’, and draw a series of 6 intersecting horizontal lines on trend line at the Fibonacci level of 0.0%,23.6%, 38.2%, 50%, 61,8% and 100%
* And observe below chart stock price retrace, support and resistance level often occur at (or) near the Fibonacci retrenchment levels
Moving Average Convergence and Divergence (MACD)
* MACD was developed by Gerald Appel. Generally technical analysis considers MACD is as logging indicator (trend indicator), But in my opinion MACD is leading indicator (Oscillator) and lagging indicator because MACD line, signal line and histograms individually display on chart, these three charts move above and below zero line and working as centered oscillators, but MACD line signal line combination and MACD line histogram combination shows trend of the market (lagging indicator)
How do we calculate the is shown below: –
MACD line = 12 days EMA – 26 days EMA
Signal line = 9 days EMA of the MACD
MACD Histograms = MAC line – Single line
MACD line, single line and histograms plotted on y-axis and x-axis would represent the days
- 12 days EMA – 26 days EMA = MACD
(Short term) (Long term)
86 – 80 = 6
85 – 81 = 4
84 – 82 = 2
83 – 83 = 0
82 – 84 = -2
81 – 85 = -4
80 – 86 = 6
- 12 days EMA – 26 days EMA = MACD
(Short term) (Long term)
80 – 86 = -6
81 – 85 = -4
82 – 84 = – 2
83 – 83 = 0
84 – 82 = 2
85 – 81 = 4
86 – 80 = 6
Conclusion about moving average and Oscillators:-
* Certain conditions moving average misleading the investors especially in bear trap conditions and bull trap conditions and one more important point, moving averages gives delayed signal to buy and sell that means exit at specific overbought zone and entry at particular oversold zone not possible with help of moving average charts
*Trend following indicators such as moving averages is excellent in trending markets, but they create confusion and mislead in trading range (narrow fluctuation or congestion or sideways or trading period) period. In this scenario, oscillators (RSI, ROC and stochastic) helping you, when prices fluctuate within a trading range.
* Here another point, Oscillator almost always gives direction to close position prematurely during trending markets
* For daily RSI —-> Look in India bulls.com —-> securities —-> Research —–> Technical analysis —> enter the script name(no-weekly charts and only 2 –years chart available)
* For daily envelopes ROC and moving the average cross over’s in MACD, OBV.
*RSI, ROC, moving averages, daily and weekly chats
For Fibonacci calculation —–> J charts (EOD)
*For open interest —–> NSE india.com —–> Equity (option chain) Equity derivatives —-> right corner
—–> Future contract —–> select particular month contract
If open interest = 10-15 % —-> then buy call option for that day —> buy 1.00 pm —–> If below 10 % —->
Go for put option
SGX – nifty(Singapore nifty)
- Opens at 6.30am in Singapore and close Evening 3.30 PM
- Again opens at 4.30 pm and close night 11.45 PM
Fundamental Analysis
ABC Ltd
Total no. of equity shares = 1 Crore units
Face value of the share = Rs.10
The share capital of the company = Rs. 10* 1 crore share = 10 crore Rs
Market value of the share = 300 Rs
Total capitalization of the company = Rs .300* 1 crore shares = 300 cores Rs
Net saris of the company = 200 crores
Gross profit of the company = Rs 60 crores
Operating profit of the company= Rs 40 crores
Net profit of the company =Rs 15 crores
Transfer to dividend account = Rs 5 crores
Income Statement
Gross sales
Less: Sales return, sales tax &excise duty
————-
Net Sales
Less: Cost of sales
—————-
Gross profit
Less: Operation expenditures
(Admin, Sales, R &D)
Operating profit
Add: other income
Less: other expenditure
Profit before interest & tax (PBIT)
Less: Interest
Profit before tax (PBI)
Less: – Tax
Net profit
Dividend payouts
—————–
Retired earnings
(Transfer to reserve)
Positional Statement
Current Asset
Less: Current Liabilities
————
Working capital
Add: Fixed Asset
————–
Capital employee
Add: Nontrading assets
(Govt securities, bonds and
Investment in other company)
Total net assets
Less: Long-term liabilities
————-
(Total shareholder fund (net-worth)
Less: Reserve and surplus
———-
Equity shares capital
Current Assets
Cash in hand
Add: – Cash in Bank
Add: – short-term market table
Securities (with & months)
————-
Absolute liquid or acid or quick assets
Add: –debts –Bad debts :
Add: –bills /notes :
———–
Liquid or acid or quick assets:
Add: –stock (finished, work in progress,
Raw):
Add: –prepaid expense (ex-insurance)
Add: – accrued but not receives income
(Interest)
————–
Current assets
—————
Current Liabilities
Creditors: xx xx xx
Bills/ Notes payable
Short term loans
(Within 6 months)
Provision for tax
Provision for depreciation
Provision for bad debts
Un-claimed dividend
Outstanding expenses and
Incomes received in advance
(Liquid or acid or quick liabilities)
—————-
Liabilities
Add: – overdraft
————-
Current liabilities:
———-
Accounting Ratios
*Gross Profit Ratio (GP) = GP /Net * 100
(Need not consider) = 60c/200c * 100 = 30 %
*Operating Profit Ratio (OP) = Operating profit / Net sales *100
=40c/200c*100 = 20%
(If a company has 35% operating profit, it is a good company and can hold the fluctuation and interests)
*Net Profit Ratio (NP) =Net Profit /Net Sales *100
= 15 C/200 C *100=7.5%
(It should increase quarter to quarter)
*Earning per share (EPs) = Net Profit/Total no. of equity shares
= 15 C/1C shares = Rs 15
* Price to Earning (PE) = market value of the share/Earning per shares
= 300rs/15 Rs= 20 times
[E.P.S * P.E = market value of the share]
*[Record P.E in mega bear and mega bull markets it will not cross that P.E in next bear and bull markets]
After 5 years
Low High —-à Low High
Rs.75 Rs.450 Rs.100 600
EPS-15 EPS-15 EPS-20 EPS-20
PE–>5 PE –> 30 PE —> 5 PE—> 30
* Dividend per share (DPS) = Distributed profit to share holders/ Total no. of equity shares
Note: – Here the company will declare 50 % divided (i.e., on face value Rs = 10 = 5 Rs on market value)
Dividend yield = DPS /market value of the share
= Rs 5/300Rs *100
= 1.66%
[at Rs 300 ——> Rs 5 dividend
For Rs100 —-> ?
= 100*5/300 = 1.66 %]
[Buy any share and hard which gives 6% – 10 % dividend yield]
Script name face value of market value dividend % dividend yield
Share of share
ABC Ltd Rs.10 Rs.300 50% Rs.5 1.66%
Infosys Rs.5 Rs.2500 800% Rs.40 1.60%
Hero Rs.1 Rs.1500 500% Rs.5 0.33%
1 crore share * Rs 300 = 300 cr
1 crore share *Rs 5 = Rs 5 cr
1.66% = 1.66%
Current Ratio = Current Assets (C.A)/Current liabilities)
=32 C/16 C = 2 times
*[Greater than 1.5 and less than 3 is preferable] – Best
[If CA/CL =1, then exit the share immediately]
[WA] working capital = CA –CL
= 16C – 16 C = zero
Expenses need to run the company (ex: – Salaries, power bills etc)
[King fisher air lines ——> never buy]
Turnover Ratios
- Investor turnover ratio = Cost of goods sold / average inventory
= Rs. 120 C/30 = 4 times
- Inventory holding period = 12 months / inventory turnover ratio
= 12 months / 4 times = 3 months
Note 1: – Cost of goods sold = Net sales – G.P
Note 2: – Average inventory = opening inventory + closing inventory /2
- Debtors turnover ratio = Net credit sales / average debtors = Rs. 150 C / Rs 25 C = 6 times
- Debtors velocity = 12months / Debtors turnover ratio = 12 months / 6 times = 2 months
Note 1: – Average debtors = opening debtors + closing debtors /2
- Creditor turnover ratio = net credit purchases / average creditors
= Rs. 72 C / Rs. 15 C = 4.8 times
- Creditor velocity = 12 months / creditors turnover ratio
= 12 months / 4.8 times
=2.5 months
Note 1: – average creditors = opening creditors + Closing creditors / 2
- Debt –equity ratio = Total debts / share holder fund
[3 times is preferable]